





Versions drift around
Five mailboxes, three "final" versions. Nobody knows which file holds the truth, and merging them costs half a day.
We connect your sources automatically into one overview built around your team. It leaves Transport Schouls with 20 hours of admin back every week.
Companies building with us
and 76+ others
Sound familiar?
Until the file started drifting around, formulas broke quietly, everyone had to wait for everyone else, and the whole thing hung on the one colleague who really understands it.
Five mailboxes, three "final" versions. Nobody knows which file holds the truth, and merging them costs half a day.
One shifted row and your margins are wrong. You notice weeks later, or your client notices first.
By the time the overview is finished, it is out of date. Decisions run on last month’s data.
One person at a time in the file. The rest wait, work on a copy or overwrite each other without noticing.
One colleague knows the formulas and the macros. If they are ill or on leave, nobody dares touch the file.
On site, in the warehouse or at a client, a spreadsheet is unusable. So everyone writes on paper and types it over in the evening.
How it works
You do not have to prepare anything. The spreadsheet doing the rounds in your team today is exactly the starting point we need.
A raw export is enough. We look together at what is in it, which questions you answer with it and where the figures come from.
One live overview, shaped around your team: automatic connections to your sources, access per role, shareable with whoever you choose.
Always up to date, on every device. From there the dashboard grows with what your team turns out to need.
Connections
Anything with an export or an API can go in: from today’s Excel file to your accounting, your planning and your webshop.
Want planning, work orders or order tracking in the same system as your figures? Then take a look at our broader service internal tools & dashboards.
Proof
Two companies that moved their planning out of Excel. These are their numbers, measured after go-live.

Transport Schouls · Transport & logistics
“A pleasant collaboration with Build More.”
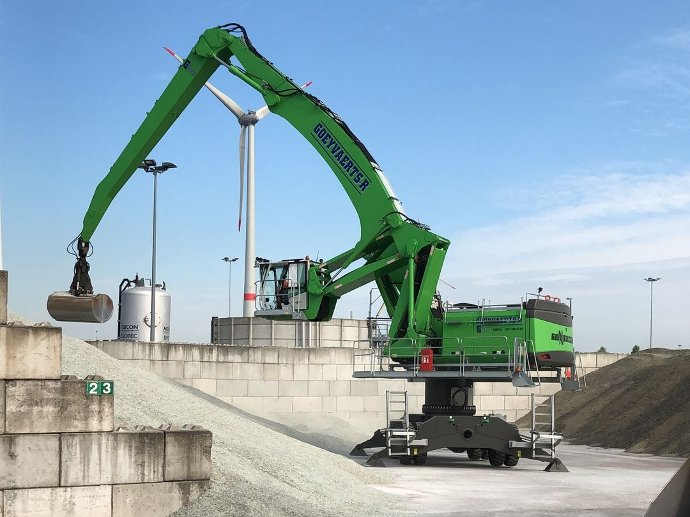
Goeyvaerts-R · Construction
“Wonderful that we now save hours of time. Thank you, Build More!”
What it costs
A dashboard usually sits well below the price of a full custom app. What it comes to for you depends on three things.
After one call you know where you stand.
Half an hour of talking is enough for a concrete scope and a price indication on paper.
Get your price indicationThe risk
The four concerns we hear most often before someone decides, and how we take each of them away on every project.
For a quick ad-hoc analysis Excel remains fine, and it can happily stay an input channel. We only replace the role Excel plays badly: shared figures for several people at once.
You do not wait months to see whether it holds up. Every week a new version goes live that your team can really open, so you steer while it is being built.
The code sits in your repository, the data in your own database. If we ever stop working together, you take everything with you without discussion.
You pay for the build, and after that for hosting and maintenance. No price per user is added, so putting ten or thirty colleagues on it costs you nothing extra.




A custom dashboard is a web application that automatically brings your company data from Excel, your accounting, your planning or your webshop together in one live overview. It is always current, shareable per role and usable on any device.
Almost anything with an export or an API: Excel and CSV files, accounting packages, planning tools, webshops, CRM systems and your own databases. In a short call we map your sources and you see right away what can run automatically.
The price depends on the number of data sources and roles. A dashboard usually sits well below the price of a full custom app. After one call you get a concrete scope and price indication within 24 hours, with no obligations.
A first working version is usually there within two to four weeks. After that we extend it based on what your team turns out to need day to day.
No. We build, host, monitor and maintain the dashboard. Your team simply logs in and works with it, on laptop, tablet or phone. The gain is biggest at SMEs without an IT department.
In your own database, and it is never used to train models. We work with data processing agreements and can choose European hosting where that matters. For sensitive data we document exactly what passes where.
Done with copy and paste?
Within 24 hours you know what a custom dashboard costs and how fast it can go live. No obligations, no sales pitch.
Excel out, one live dashboard in.
May we collect anonymous usage data to improve this website? More information