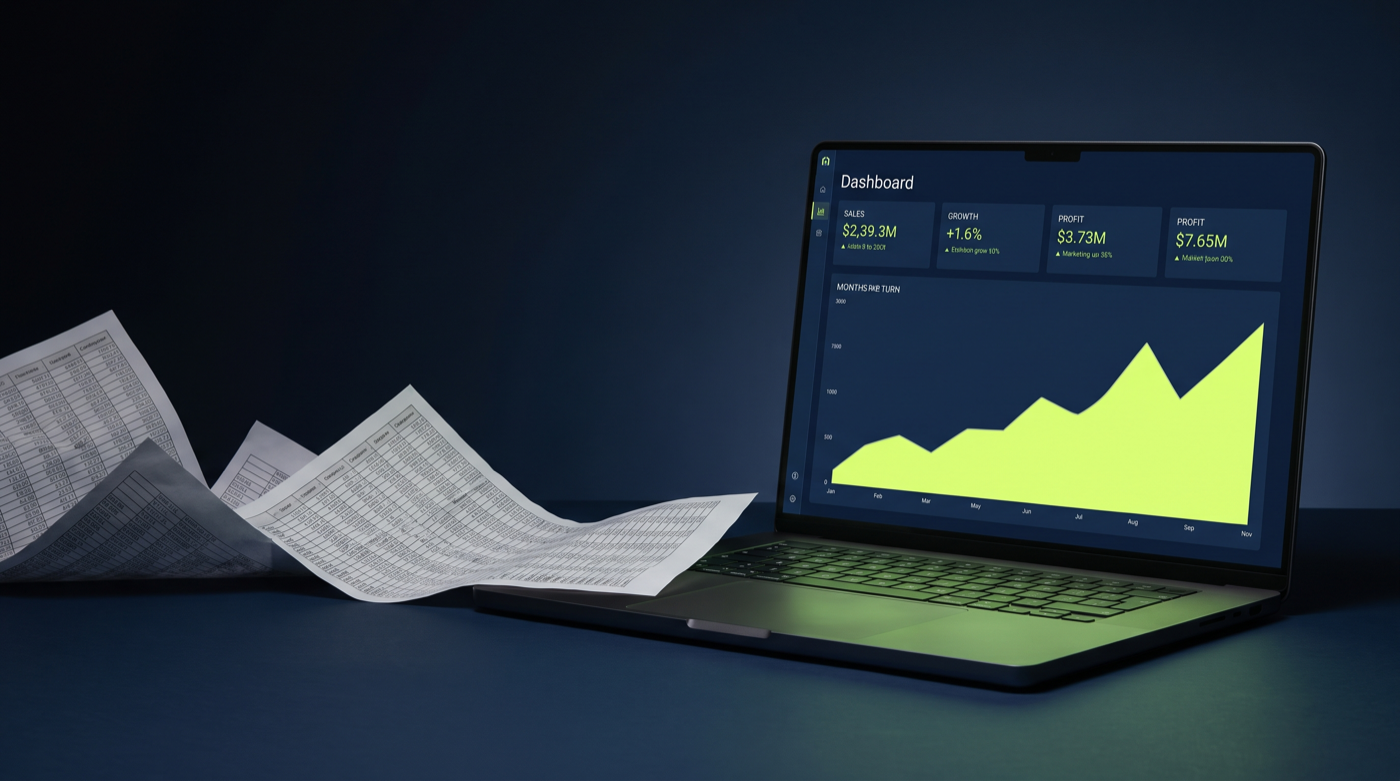
Custom dashboard: from scattered spreadsheets to one view
A custom dashboard brings the numbers from all your systems together in one live overview, so you stop waiting for a monthly export to know how your business is doing. The cost usually sits close to that of an internal tool: from €8,000 for a full dashboard with live connections, less if your data already sits properly in one system. There is one important condition: a dashboard is only as good as the data underneath it. Here is when it pays off, what it costs and what to watch out for.
What is a custom dashboard?
A custom dashboard is a screen that shows the numbers that matter to you, pulled live from your own systems. Think revenue per client, margins per project, open orders, the week's planning or stock dropping below a threshold. Instead of keeping five tabs and three exports open, you look at one overview that updates itself.
The difference with an ordinary reporting tool lies in what you can do with it. A classic dashboard shows numbers. A custom dashboard also lets you act from that same screen: approve an order, change a status, send a reminder. The overview and the action sit in one place.
When do you need a custom dashboard?
The signals look a lot like those of a spreadsheet that is due for replacement:
- Your numbers are scattered across several spreadsheets, tools and mailboxes.
- You only get a complete picture at the end of the month or the quarter.
- Someone spends hours every month assembling the same report.
- Decisions about pricing, planning or stock are made on numbers nobody checks any more.
And that scattering keeps widening rather than closing. According to the FPS Economy, 46.3% of Belgian SMEs used cloud services in 2025, up from 35.5% in 2023. The more systems you run, the further your data drifts apart, and the greater the need for one place that brings it all back together.
What does a custom dashboard cost?
Two scenarios, two price brackets.
| Type | What it is | Indicative price |
|---|---|---|
| Reporting layer | Charts on top of data that already sits properly in one system | from a few thousand euro |
| Full custom dashboard | Live connections to several sources, plus actions in the same screen | €8,000 – €25,000 |
What drives the price most is the number of sources that have to be connected. One clean data source is quick work. Five systems that each keep their data in their own way take more integration and clean-up work. There is more on how those ranges work in what custom software costs.
The trap: a dashboard does not fix bad data
This is the mistake we see most often. A company wants "just a nice dashboard" while the underlying data is a mess: the same customer existing three times, statuses hidden in colour codes, amounts retyped by hand. A chart on top of that data is decoration, and worse, it hands you a false sense of control.
That is why we always build in this order: one source of truth first, then the workflow, and only then the dashboard. Every customer, order or machine exists exactly once, with clear statuses. On clean data, a dashboard is a matter of days. On messy data, it is a problem in a pretty wrapper.
A standard BI tool or a custom dashboard?
Not every dashboard has to be custom. Standard tools like Power BI or Looker are excellent at showing numbers on top of data that is already well structured, and they are quick to set up. Use this rule of thumb:
Choose a standard BI tool if you only want to report, your data already sits neatly in one system and nobody has to steer from the overview.
Choose a custom dashboard if you want to act from that same screen as well, you have several systems to bring together, or the overview is part of a wider custom platform your team uses every day.
Drowning in scattered spreadsheets and exports? Describe on the contact page which numbers you scrape together every week and we will tell you whether a custom dashboard is worth it or a standard tool will do. Sometimes a clean data source is the real win and the dashboard follows from it on its own.
Frequently asked questions
- Why the data first and the dashboard after?
- Because a chart on top of messy data is a pretty lie. If the same customer exists three times and statuses are hidden in colour codes, no total adds up. So we fix one source of truth first and build the dashboard on top of it, rather than the other way round.
- Can a dashboard pull live data from our existing systems?
- Yes. We connect through APIs or imports to your accounting package, planning, CRM or webshop, so the numbers come in automatically without exports or copy-paste. That gives you a current picture instead of last week’s export.
- Which companies does a custom dashboard pay off for?
- Mainly companies that take decisions on numbers from several systems and that only get a complete picture at the end of the month or the quarter. If assembling that overview costs hours of cutting and pasting every month, a dashboard pays for itself quickly.